UCSD Biochemical Genetics Laboratory
Metabolomic Functions
Welcome to Visual Biochemical Genetics.
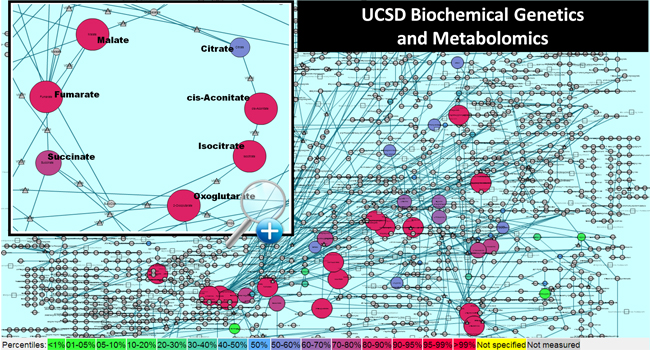
Explore metabolic pathways, and visualize your biochemical resultsYou can view our lab's results superimposed on a collection of metabolic pathways, to indicate which metabolites are outside of reference ranges. We have imported a nearly complete set of pathways from the KEGG collection, and are continually extending local maps to emphasize the compounds we measure on our metabolomics platforms. We are also working with the UCSD Biomolecular and Proteomic Mass Spectrometry Facility.
Results of both metabolomics (HMDB) and proteomics (Uniprot) can be entered together. Our lab will provide you with data which can be pasted directly into the software below. Choose the data and the network below, and then view the map (note: clicking rectangles in maps also links to other maps, so the entire kegg-space can be explored)..
Newer Software:
- Browse KEGG- and KEGG-like Maps:
Choose map, to browse and link from map-to-map.
Maps are stored in KGML extended markup format.
Coming soon: edit and create your own maps to submit to the list.
- Project Your Omics Data on Maps/ Pathway Enrichment:
Enter your data in standard format, and then visualize.
Data must be arranged in three columns: 1) identifier (HMDB or Uniprot), 2) fold-change, 3) significance (p- or q-value).
Data may be pasted from comma-separated (CSV) format, space-delimited, or tab-delimited format (as from pasted Excel worksheets).
You will see a listing of pathways in which the specified metabolites are found, and links to display the data superimposed on the pathways.
- Find Identifiers:
Find HMDB identifiers to enter 'omics data.
Data is simple arranged in one column, specifying chemical names or identifiers.
Data may be pasted from comma-separated (CSV) format, space-delimited, or tab-delimited format (as from pasted Excel worksheets).
You will see a listing of identifiers or synonyms for the specified metabolites, and links to display information.
List all HMDB identifiers. (warning: takes a few minutes)
Old Software
