UCSD Biochemical Genetics Laboratory
Metabolomic Functions
Acquisition
- Chemometric analysis
Samples are analyzed by gas-chromatography (Agilent 5971 and 5973 mass-specific detectors) and by triple-quadrupole tandem mass spectrometry (ABI API-2000, API-4000, and 5500) in positive and negative ionization (with electrospray ionization), and/or tandem quadrupole-time of flight mass spectrometry (ABI 5600).
- Metabolomic analysis
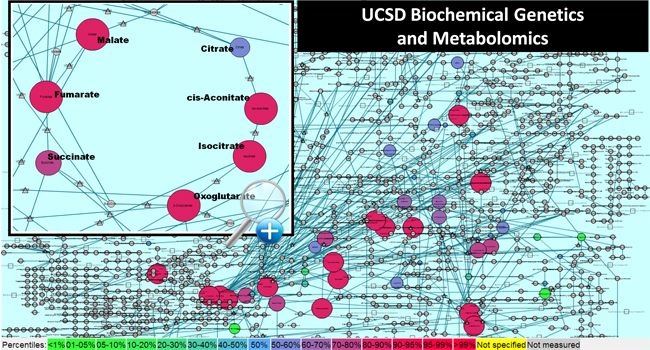
Identified species are related to a scheme of chemical ontology based on expert system and organized with software from the Cytoscape and KEGG systems. Results of series are processed and normalized with nonlinear peak-matching programs including XCMS and MarkerView.
- Relevance
Results of all samples processed at the UCSD Biochemical Genetics Laboratory may be visualized on Cytoscape and KEGG maps to illustrate relationships of metabolite profiles. With full sets of series to be compared, as in traditional metabolomic datasets, statistical methods are applied to determine changes in metabolism.
Clients: In order to view your datasets, proceed to Visualization and enter the sample number.